Overview
The Manhattan Active SCI Status tracks and monitors the usage of SCI across Manhattan Active® products. It intends to continuously monitor and inform users to take proactive actions for interactive and scheduled reports, performance and configuration-related issues, and long-running reports that signal a potential risk of crashing and avoid downtime.
You can access it by navigating to Team Content > SCI Audit Reports > System Activity > Manhattan Active SCI Status.
Manhattan Active SCI Status contains the date filter which you can use to reflect data accordingly. The following table explains the sections it includes. Some sections comprise links to detailed reports that you can view for more insights and analysis.
Report Prompt
The following table explains the fields on the prompt page of this report:
| Prompt Field | Description |
|---|---|
| Select Date | The default value for this filter is ‘Last 24 Hr’, and you can also select a date from the last 15 days. |
| Report Type | You can select the report type that fetches values from ‘Report reportservice’, ‘ReportView reportservice’, or ‘Exploration queryservice’. |
| Type | You can run the report for Standard and Unsaved reports. |
Report Sections
The following table describes the sections in the Manhattan Active SCI Status report and their color coding parameters:
| Section Name | Description | Color Code for Visualization |
|---|---|---|
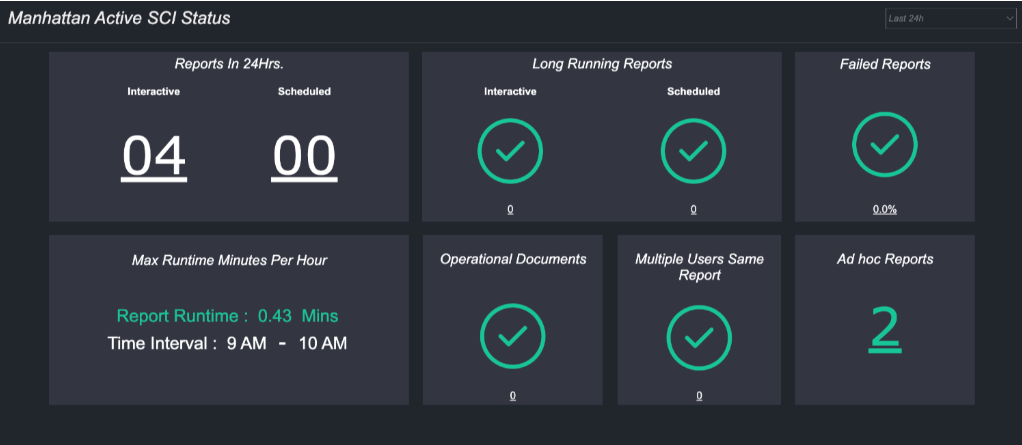
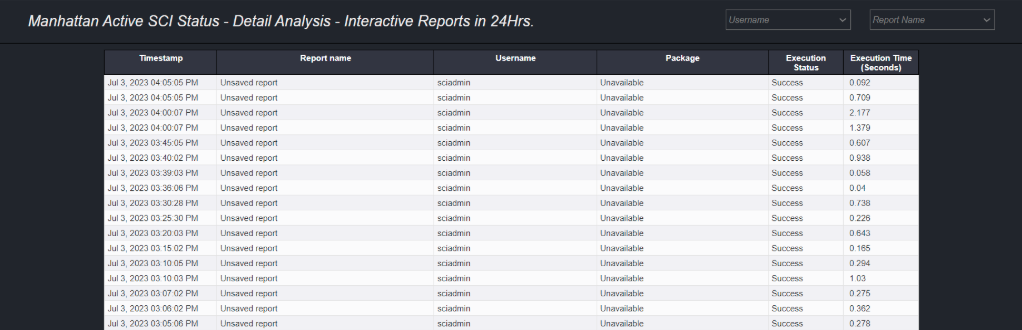
| Reports in 24Hrs | This visualization includes two metrics for Interactive and Scheduled reports to capture the number of reports users execute in the SCI instance. Detailed Report: You can access the drill-down or detailed report for interactive and scheduled reports by clicking the links on the numbers. This page provides the report name, timestamp, username, package, execution status, execution time in seconds, and issues. You can also filter the drill-down reports by report name and/or username. | Note: The Interactive and Scheduled report metrics do not have any threshold defined. |
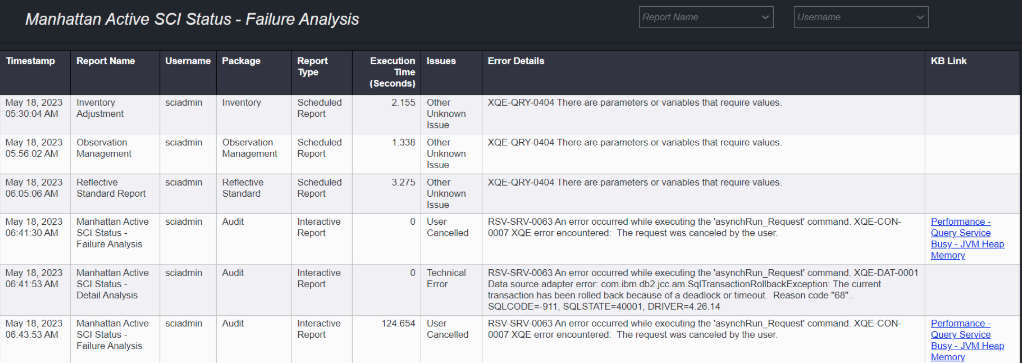
| Failed Reports | This visualization indicates the percentage of reports that failed to generate for the date you select. Detailed Report: This section also contains a link to the drill-down or detailed report that includes the report name, timestamp, username, package, report type, execution time in seconds, issues, error details, and KB link. You can also filter the drill-down reports by report name and/or username. | Green : less than 2% ,Yellow : between 2 and 3% ,Red : greater than or equal to 3% |
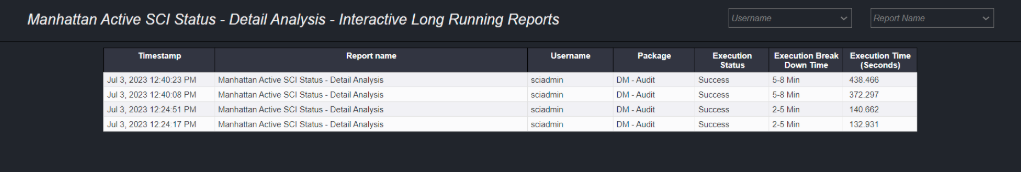
| Long Running Reports | This section provides the number of reports that ran for more than two minutes for Interactive and 30 minutes for schedule. Depending upon the data availability, this report displays either a Green check or a bar visualization for a report type as shown in the image. Detailed Report: To access the drill-down or detailed report for interactive and scheduled reports, | Color Codes for Interactive Reports :Green : greater than or equal to 0 but less than or equal to 2,Yellow : greater than or equal to 2 but less than or equal to 5,Red : greater than 5,Maximum: 8.Color Codes for Scheduled Reports:Green : less than or equal to 30,Yellow : greater than or equal to 31 but less than or equal to 60,Red : greater than 60, Maximum: 90 |
| Max Runtime Minutes Per Hour | This section provides the highest execution time in minutes per hour for a day and the time interval when it is at its maximum. | Note: The report metrics do not have any threshold defined. |
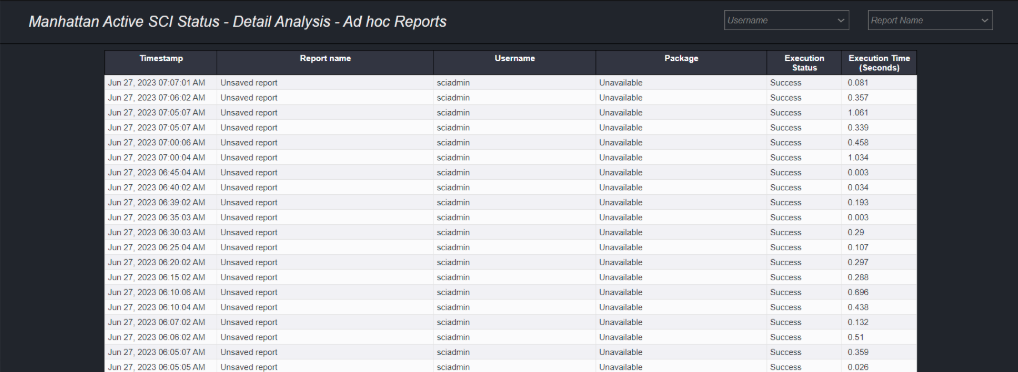
| Ad hoc Reports | This section provides a count of all ad hoc or unsaved reports users execute. Detailed Report: You can access the drill-down or detailed report by clicking the links on the number. This page provides the report name, timestamp, username, package, execution status, report type, and execution time in seconds. You can also filter the drill-down reports by report name and/or username. | Green : less than or equal to 2,Yellow : greater than or equal to 2 but less than or equal to 5,Red : greater than 5 |
| Operational Documents | This section highlights the number of operational documents that users execute. Examples of these documents are packing lists, bills of lading, and others. | Red : greater than 0 |
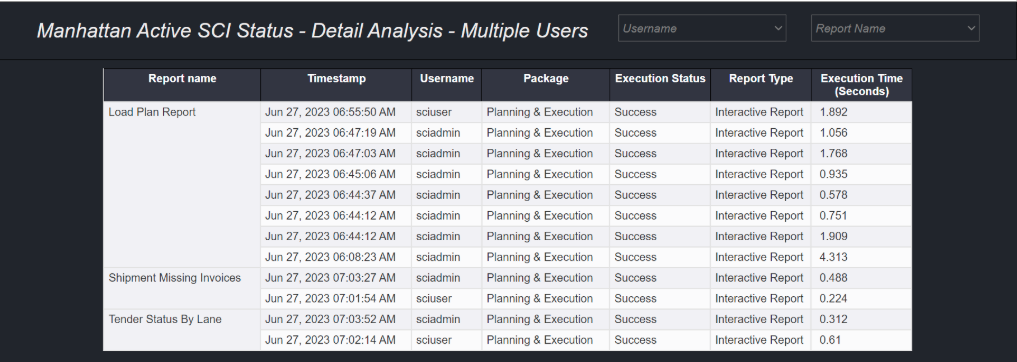
| Multiple Users Same Report | This section provides the number of reports that multiple users execute in an hour of a day. Detailed Report: You can access the drill-down or detailed report by clicking the links on the number. This page provides the report name, timestamp, username, package, execution status, report type, and execution time in seconds. | Green : greater than or equal to 0 but less than or equal to 5,Yellow : greater than or equal to 5 but less than or equal to 10,Red : greater than 10 |
Report Types
The following table summarizes the standard IBM Cognos report types used in Operational SCI and their category in the Manhattan Active SCI Report:
| IBM Cognos Service Type | Report Type | Metric Category/Usage in Manhattan Active SCI Status Report |
|---|---|---|
| Exploration queryservice | Dashboards/Story | Not considered in the MA Active status report |
| Exploration queryservice | Unsaved Report | Adhoc |
| Report reportservice | Unsaved Report | Interactive / Adhoc |
| Report reportservice | Standard Report | Interactive |
| Report batchreportservice | Standard Report | Scheduled |
| ReportView batchreportservice | Standard Report | Scheduled |
| Report promptforward reportservice | Unsaved Report | Not considered in the MA Active status report |
| Report promptforward reportservice | Standard Report | Not considered in the MA Active status report |
Manhattan Active SCI Status
Drill-down report for reports in 24Hrs
Drill-down report for long-running reports
Drill-down report for failed reports
Drill-down report for multiple users same report
Drill-down report for ad hoc reports